call today for your free evaluation
call today for your free evaluation
According to the Centers for Disease Control and Prevention, breast cancer is the second most common cancer found among women in the United States. Each year, about 264,000 cases of female breast cancer are diagnosed and 42,000 women pass away from the medical condition. Although deaths from female breast cancer have declined over time, it is still the second-most fatal type of cancer affecting women worldwide.
To immediately access the data at any point in this study, please click the corresponding links below.
Types of Breast Cancer
What is HER2+ Breast Cancer?
Health Effects from Breast Cancer
Rate of Breast Cancer by U.S. States
10 States with Highest Breast Cancer Rates
10 States with Lowest Breast Cancer Rates
Rate of Breast Cancer Deaths by State
Cancer Death Trends and Facts
Stage Distribution of Breast Cancer Cases
Stage Distribution of HER2+ Cases
Stage Distribution of HER2+ Cases by Age
Breast cancer develops in breast tissue when cells grow out of control. The three main components of a human breast include the lobules, ducts and connective tissues. Most forms of breast cancer tend to initially form in the ducts or lobules, but the cancer can spread to other parts of the body. Although breast cancer typically effects women, it can also affect men.
There are multiple types of breast cancer, but the most commonly diagnosed types are ductal carcinoma and lobular carcinoma. Ductal carcinoma starts in the milk duct cells, and it’s responsible for about 80% of all breast cancers. On the other hand, lobular carcinoma starts in the milk-producing cells and accounts for about 10-15% of all breast cancers.
Other less frequent types of breast cancer include inflammatory breast cancer, triple-negative breast cancer, and HER2-positive (HER2+) breast cancer. Inflammatory breast cancer is a rare and severe type of cancer that can make the victim’s breast look red and swollen. Triple-negative breast cancer cells lack estrogen, progesterone, or HER2 receptors, and the cancer tends to be more aggressive. A victim with HER2+ breast cancer has too many HER2 proteins, which control how quickly cells grow and divide. An excess of HER2 proteins can lead to rapidly growing cancers. Understanding the various types of breast cancer is essential because it can have a significant impact on the treatment plan and outlook for the patient.
HER2+ breast cancer is a type of breast cancer signified by the presence of a protein known as human epidermal growth factor receptor 2 (HER2). HER2 can increase the rate at which cancerous cells grow, making it a particularly deadly form of cancer. These types of cancers tend to spread faster than breast cancers that are HER2 negative (HER2-) and are more likely to respond to treatment that target HER2.
In about 1 of every 5 breast cancers, the cancer cells have extra copies of the gene that makes the HER2 protein. HER2+ breast cancers tend to be more aggressive than other types of breast cancer.
HER2 can be detected through two types of test: an immunohistochemistry (IHC) test or the fluorescence in situ hybridization (FISH) test. It is important to note that although testing for HER2 is essential to determine the types of treatment you should get, there are still risks involving testing and diagnosis. Receiving a misdiagnosis in an HER2 test could lead to months or even years of unnecessary chemotherapy, along with severe side effects.
Cancer patients usually experience significant side effects due to their cancer diagnosis or treatment. The kind of effects they face depends on the type of cancer, treatment, and their overall health. The most frequent side effects experienced by cancer patients are fatigue, loss of appetite, nausea, and weight loss. Other symptoms can include:
Breast cancer screening refers to the use of various tests and examinations to detect the presence of cancer in individuals who do not show any symptoms. The goal of cancer screening is to identify cancer early, when it’s more likely to be treatable and has a higher chance of being cured. There are various methods used for cancer screening, and the most appropriate one will depend on the type of cancer being screened for and the individual’s age, medical history, and risk factors.
One of the most common breast cancer screening tests is a mammogram, which is used to screen for breast cancer. During a mammogram, an X-ray of the breast is taken to identify any abnormalities or masses that may be indicative of cancer. Other screening tests include a colonoscopy, which is used to screen for colorectal cancer, and a Pap smear, which is used to screen for cervical cancer.
Screening tests, however, do come with some degree of risk. Some screening tests can cause serious problems, as people may get false-positive or false-negative test results. Either way, you do not want to receive an outcome that is not true. Receiving a false-negative can put you at more risk as you may not receive timely treatment for your medical condition. Receiving a false-positive may cause you anxiety and result in more tests, which may also come with more risks. Similarly, if a doctor has failed to diagnose or misdiagnosed breast cancer, it could lead to dangerous risks and outcomes for your body, as you may not receive the treatment that you need.
An alternative way to test for breast cancer is a self-exam test you may do anywhere, even at home. Self-exams involve an individual examining their own breast for any changes or abnormalities. Self-exams are not recommended as your only method of screening for cancer, but are useful for detecting alarming changes. If you do notice anything worrisome, you should seek medical advice immediately.
In 2019, over 264,000 new cases of breast cancer were reported among women. The map below shows the age-adjusted rates of new cancer per 100,000 women by state.
*Nevada is excluded as breast cancer data was suppressed in the CDC data*
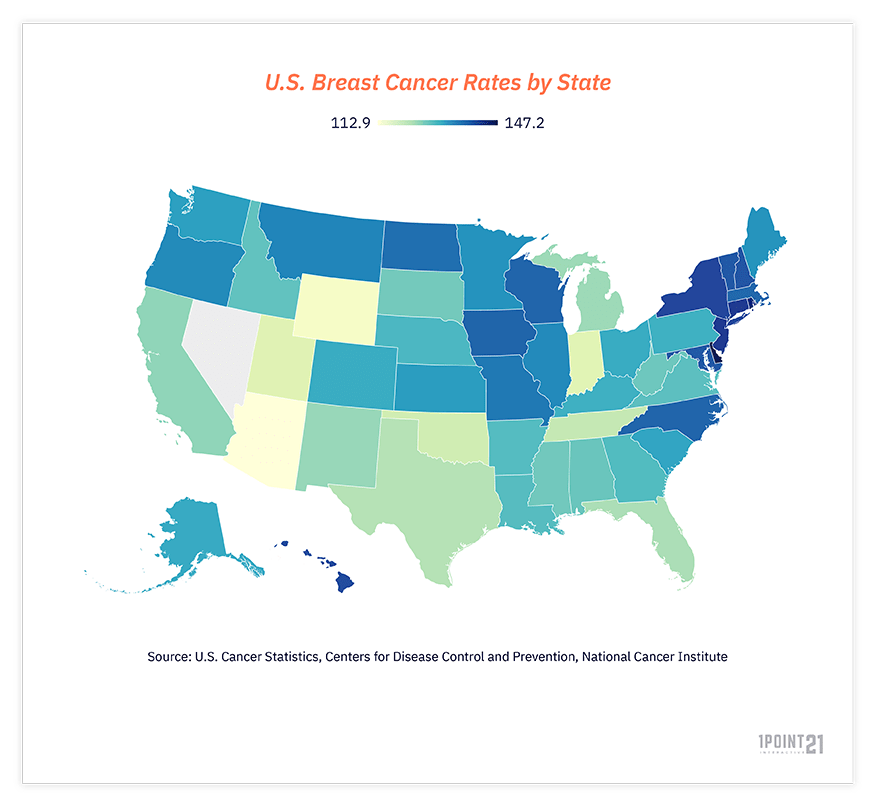
Delaware and Rhode Island had the highest rates of new cancer diagnoses with 147.2 and 144.7 cases per 100,000 people, respectively. Meanwhile, the two states with the lowest rates of new breast cancer cases were Arizona and Wyoming with 112.9 and 114.9 cases per 100,000 people, respectively.
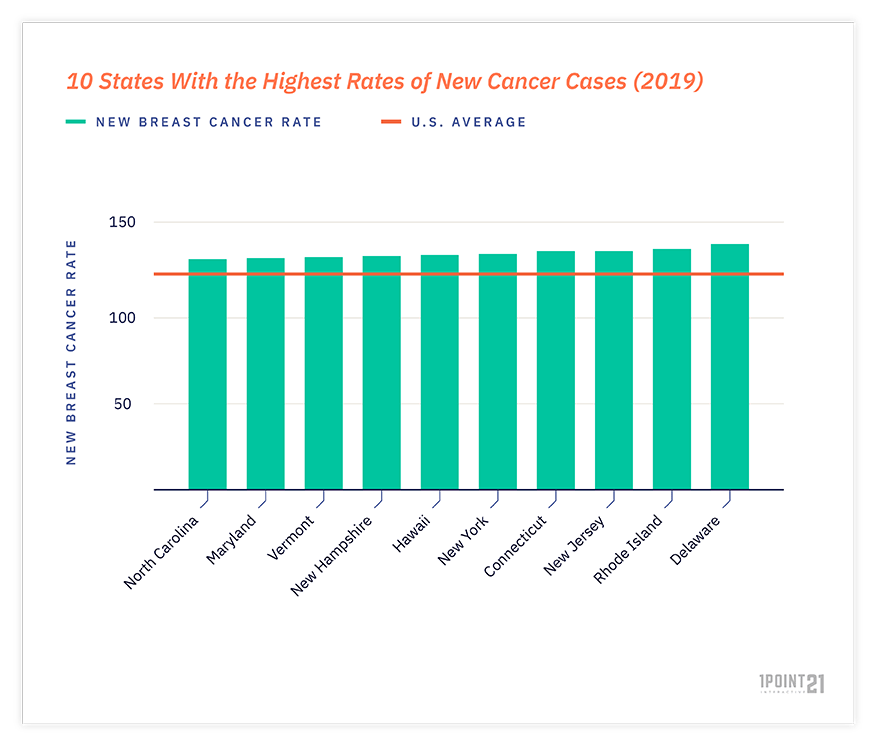
#1 Delaware
New Breast Cancer Rate: 147.2 per 100,000 women (991 new cases)
Breast Cancer Death Rate: 20.4 per 100,000 women (141 deaths)
#2 Rhode Islands
New Breast Cancer Rate: 144.7 per 100,000 women (1,009 new cases)
Breast Cancer Death Rate: 18.3 per 100,000 women (142 deaths)
#3 New Jersey
New Breast Cancer Rate: 142.7 per 100,000 women (8,208 new cases)
Breast Cancer Death Rate: 20.0 per 100,000 women (1,253 deaths)
#4 Connecticut
New Breast Cancer Rate: 142.5 per 100,000 women (3,396 new cases)
Breast Cancer Death Rate: 16.7 per 100,000 women (440 deaths)
#5 New York
New Breast Cancer Rate: 141.2 per 100,000 women (17,730 new cases)
Breast Cancer Death Rate: 18.2 per 100,000 women (2,491 deaths)
#6 Hawaii
New Breast Cancer Rate: 140.5 per 100,000 women (1,272 new cases)
Breast Cancer Death Rate: 19.5 per 100,000 women (193 deaths)
#7 New Hampshire
New Breast Cancer Rate: 139.6 per 100,000 women (1,319 new cases)
Breast Cancer Death Rate: 19.7 per 100,000 women (201 deaths)
#8 Vermont
New Breast Cancer Rate: 139.2 per 100,000 women (609 new cases)
Breast Cancer Death Rate: 15.9 per 100,000 women (79 deaths)
#9 Maryland
New Breast Cancer Rate: 139.2 per 100,000 women (5,375 new cases)
Breast Cancer Death Rate: 19.3 per 100,000 women (789 deaths)
#10 North Carolina
New Breast Cancer Rate: 138.1 per 100,000 women (9,420 new cases)
Breast Cancer Death Rate: 19.2 per 100,000 women (1,355 deaths)
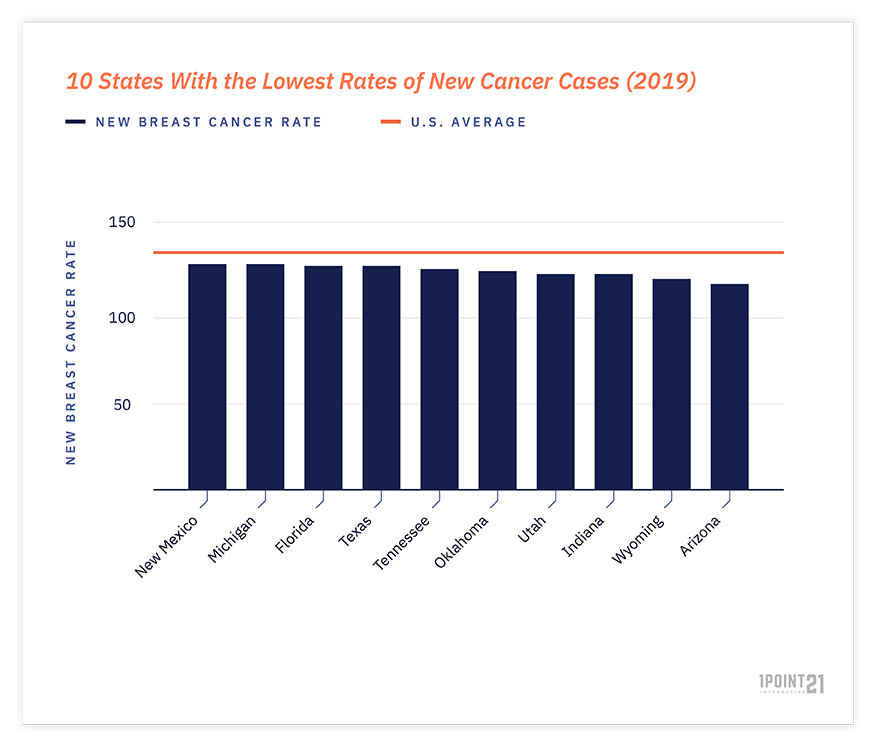
#1 Arizona
New Breast Cancer Rate: 112.9 per 100,000 women (5,234 new cases)
Breast Cancer Death Rate: 18.3 per 100,000 women (900 deaths)
#2 Wyoming
New Breast Cancer Rate: 114.9 per 100,000 women (416 new cases)
Breast Cancer Death Rate: 17.4 per 100,000 women (62 deaths)
#3 Indiana
New Breast Cancer Rate: 118.3 per 100,000 women (4,971 new cases)
Breast Cancer Death Rate: 19.3 per 100,000 women (847 deaths)
#4 Utah
New Breast Cancer Rate: 118.5 per 100,000 women (1,763 new cases)
Breast Cancer Death Rate: 19.1 per 100,000 women (285 deaths)
#5 Oklahoma
New Breast Cancer Rate: 120.1 per 100,000 women (2,885 new cases)
Breast Cancer Death Rate: 21.4 per 100,000 women (539 deaths)
#6 Tennessee
New Breast Cancer Rate: 121.2 per 100,000 women (5,376 new cases)
Breast Cancer Death Rate: 20.6 per 100,000 women (984 deaths)
#7 Texas
New Breast Cancer Rate: 122.4 per 100,000 women (19,222 new cases)
Breast Cancer Death Rate: 20.0 per 100,000 women (3,145 deaths)
#8 Florida
New Breast Cancer Rate: 123.0 per 100,000 women (18,836 new cases)
Breast Cancer Death Rate: 19.1 per 100,000 women (3,155 deaths)
#9 Michigan
New Breast Cancer Rate: 123.9 per 100,000 women (8,045 new cases)
Breast Cancer Death Rate: 19.9 per 100,000 women (1,389 deaths)
#10 New Mexico
New Breast Cancer Rate: 124.3 per 100,000 women (1,655 new cases)
Breast Cancer Death Rate: 20.9 per 100,000 women (288 deaths)
*It is important to note that the rate is based off the population of the state, hence some of the lower-rated states having more new cases*
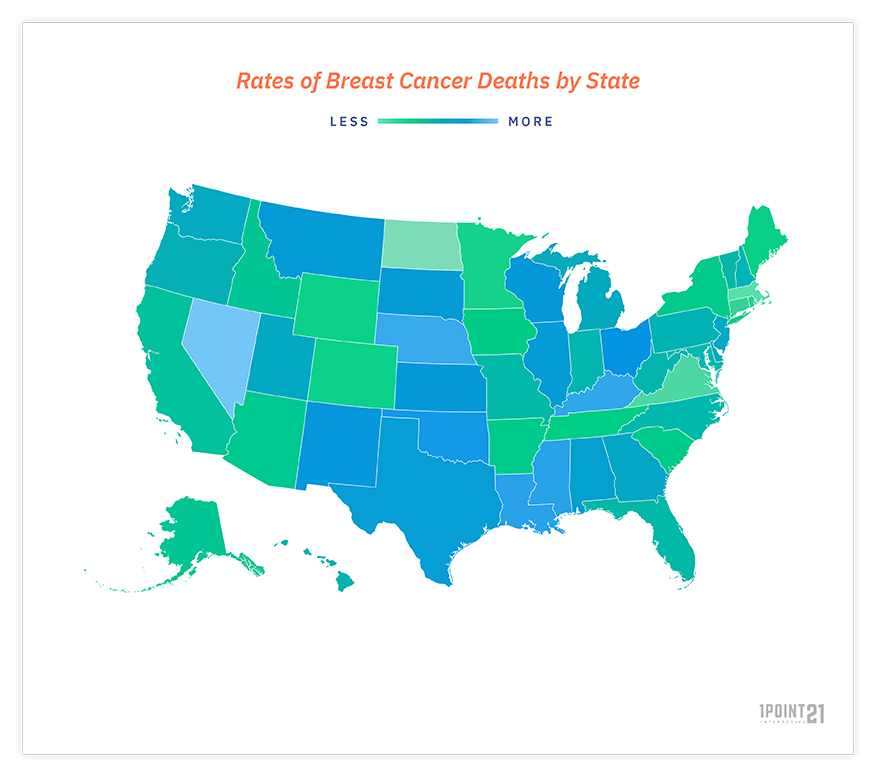
The table below shows the age-adjusted rate of breast cancer deaths throughout the United States in 2019, the number of related deaths within each state, and the population in each state.
| Area | Age-Adjusted Rate | Death Count | Population |
|---|---|---|---|
| Alabama | 20.4 | 711 | 2,536,133 |
| Alaska | 18.4 | 68 | 350,790 |
| Arizona | 18.3 | 900 | 3,669,041 |
| Arkansas | 18.2 | 375 | 1,538,076 |
| California | 18.7 | 4527 | 19,829,085 |
| Colorado | 17.6 | 605 | 2,857,610 |
| Connecticut | 16.7 | 440 | 1,826,990 |
| Delaware | 20.4 | 141 | 504,571 |
| District of Columbia | 24.3 | 97 | 372,393 |
| Florida | 19.1 | 3155 | 10,987,074 |
| Georgia | 20.1 | 1302 | 5,462,335 |
| Hawaii | 19.5 | 193 | 706,419 |
| Idaho | 18.5 | 202 | 891,995 |
| Illinois | 20.7 | 1758 | 6,443,120 |
| Indiana | 19.3 | 847 | 3,411,571 |
| Iowa | 18.1 | 396 | 1,586,636 |
| Kansas | 20.8 | 411 | 1,462,080 |
| Kentucky | 22.1 | 657 | 2,269,036 |
| Louisiana | 21.9 | 667 | 2,385,969 |
| Maine | 17.7 | 192 | 686,674 |
| Maryland | 19.3 | 789 | 3,122,480 |
| Massachusetts | 15.3 | 758 | 3,548,380 |
| Michigan | 19.9 | 1389 | 5,066,743 |
| Minnesota | 17.3 | 650 | 2,830,663 |
| Mississippi | 21.9 | 433 | 1,534,587 |
| Missouri | 19.1 | 810 | 3,127,846 |
| Montana | 20.7 | 156 | 531,486 |
| Nebraska | 22.3 | 276 | 967,601 |
| Nevada | 23.7 | 440 | 1,541,266 |
| New Hampshire | 19.7 | 201 | 686,814 |
| New Jersey | 20 | 1253 | 4,545,698 |
| New Mexico | 20.9 | 288 | 1,060,654 |
| New York | 18.2 | 2491 | 10,012,065 |
| North Carolina | 19.2 | 1355 | 5,393,755 |
| North Dakota | 14.7 | 67 | 372,678 |
| Ohio | 21.1 | 1744 | 5,962,634 |
| Oklahoma | 21.4 | 539 | 1,999,160 |
| Oregon | 19.6 | 573 | 2,126,006 |
| Pennsylvania | 19.5 | 1879 | 6,526,489 |
| Rhode Island | 18.2 | 142 | 543,197 |
| South Carolina | 20.7 | 751 | 2,659,704 |
| South Dakota | 18 | 107 | 439,553 |
| Tennessee | 20.6 | 968 | 3,498,429 |
| Texas | 20 | 3145 | 14,591,903 |
| Utah | 19.1 | 285 | 1,589,845 |
| Vermont | 15.9 | 79 | 315,738 |
| Virginia | 19.9 | 1111 | 4,345,858 |
| Washington | 19.3 | 916 | 3,802,546 |
| West Virginia | 20.8 | 284 | 906,103 |
| Wisconsin | 17.6 | 695 | 2,925,732 |
| Wyoming | 17.4 | 62 | 284,406 |
Breast cancer is the second-highest cause of cancer deaths for women, with 19.4 deaths per 100,000 women. Only lung cancer has a higher mortality rate. According to the American Cancer Society, the average risk of a woman in the U.S. developing breast cancer sometime in their life is about 13%.
Here are some facts regarding breast cancer:
Below is a bar graph of the annual rate of new breast cancer cases between 1999 to 2019.
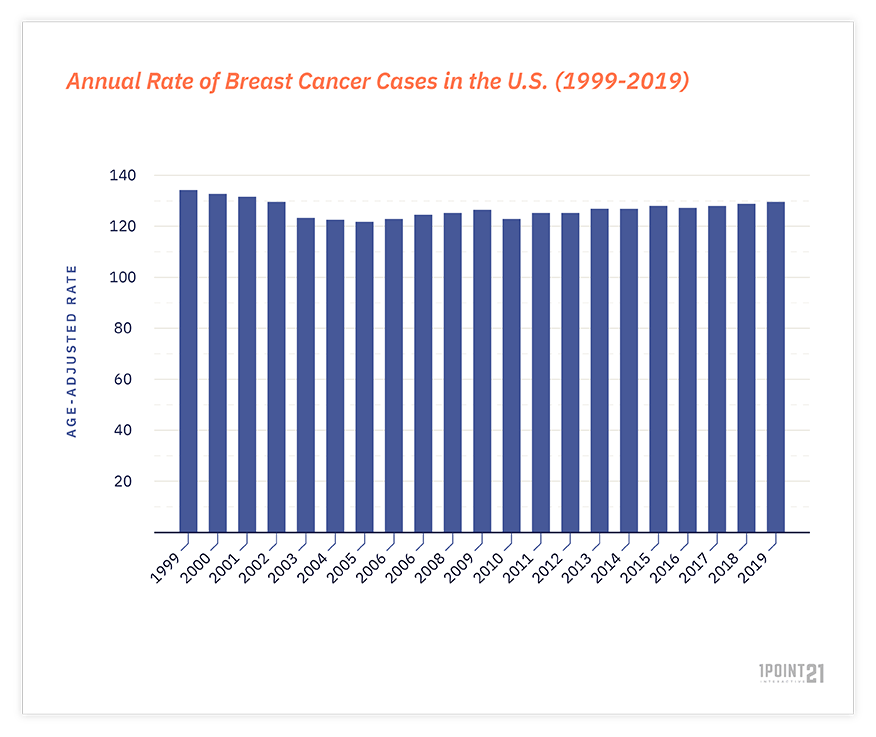
Looking at the data, the trend of new cancer rates seems to have gone down from its highest in 1999 with 134.8 cases per 100,000 women. Although the rate of new cancer diagnoses seems to have gone down from 1999 and remained steady throughout the years, the number of new cases and deaths have gone up as the population in the United States has continued to expand.
| Year | Age-Adjusted Rate | Case Count | Population |
|---|---|---|---|
| 1999 | 134.8 | 198,591 | 140,394,214 |
| 2000 | 132.7 | 198,703 | 141,865,770 |
| 2001 | 132 | 201,252 | 143,603,977 |
| 2002 | 129.3 | 200,566 | 144,919,222 |
| 2003 | 122.8 | 195,489 | 147,679,036 |
| 2004 | 121.5 | 196,497 | 148,977,286 |
| 2005 | 121.3 | 199,714 | 150,319,521 |
| 2006 | 122.2 | 204,266 | 151,732,647 |
| 2007 | 123.8 | 210,745 | 153,166,353 |
| 2008 | 125 | 216,405 | 154,604,015 |
| 2009 | 126.2 | 222,176 | 155,964,075 |
| 2010 | 122.2 | 219,034 | 157,249,665 |
| 2011 | 124.8 | 227,046 | 158,370,501 |
| 2012 | 124.8 | 230,742 | 159,480,635 |
| 2013 | 126.4 | 237,380 | 160,545,893 |
| 2014 | 126.7 | 241,797 | 161,690,519 |
| 2015 | 127.8 | 247,921 | 162,832,151 |
| 2016 | 126.9 | 250,145 | 163,986,062 |
| 2017 | 127.4 | 254,884 | 165,008,683 |
| 2018 | 128.5 | 258,152 | 164,367,226 |
| 2019 | 129.7 | 264,121 | 165,096,351 |
Stage distribution is how far a cancer has spread from its origin. This is measured by four different stages:
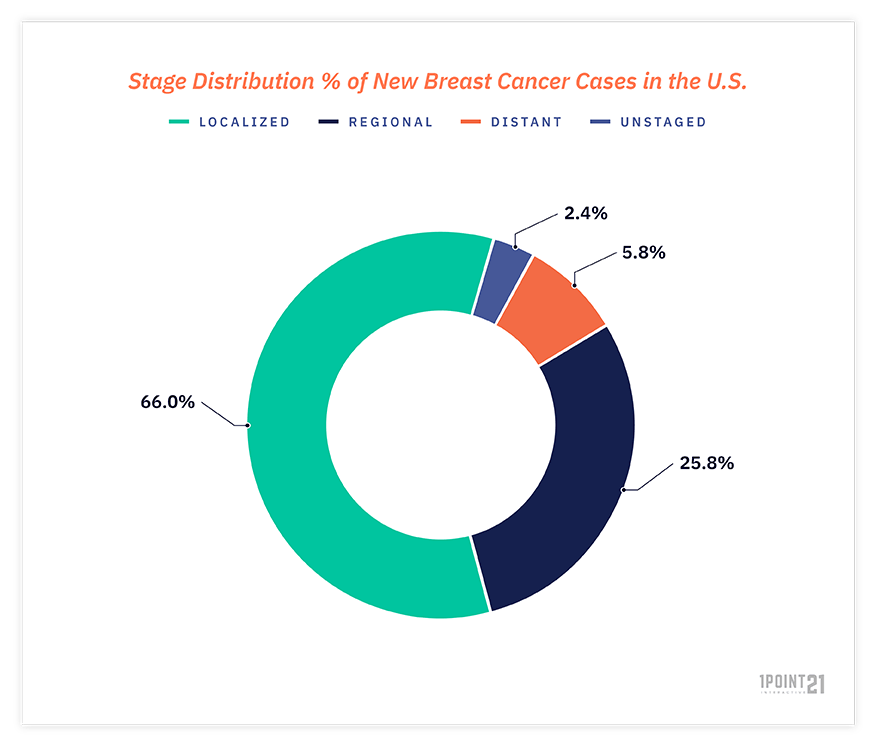
Most breast cancer patients have been diagnosed at a localized stage (66%), while only 2.4% of patients have been diagnoses with unstaged cancer.
| Year of Diagnosis | Localized | Regional | Distant | Unstaged |
|---|---|---|---|---|
| 2010 | 6.02 | 4.05 | 0.85 | 0.12 |
| 2011 | 6.02 | 4.19 | 0.9 | 0.09 |
| 2012 | 6.23 | 4.31 | 0.99 | 0.09 |
| 2013 | 6.56 | 4.27 | 1 | 0.1 |
| 2014 | 7.08 | 4.65 | 1.04 | 0.13 |
| 2015 | 7.37 | 4.61 | 1.09 | 0.12 |
| 2016 | 7.46 | 4.65 | 1.12 | 0.17 |
| 2017 | 7.42 | 4.5 | 1.02 | 0.14 |
| 2018 | 7.26 | 4.26 | 1.01 | 0.15 |
| 2019 | 7.09 | 4.15 | 1.04 | 0.14 |
| 2020 | 6.34 | 3.96 | 0.96 | 0.13 |
| Year of Diagnosis | Localized | Regional | Distant | Unstaged |
|---|---|---|---|---|
| 2010 | 2.4364 | 1.9244 | 0.4718 | 0.0431 |
| 2011 | 2.5156 | 1.99 | 0.4803 | 0.0431 |
| 2012 | 2.4318 | 2.0066 | 0.5197 | 0.0242 |
| 2013 | 2.5589 | 1.9234 | 0.5758 | 0.0339 |
| 2014 | 2.6484 | 2.1266 | 0.563 | 0.0423 |
| 2015 | 2.9106 | 2.1029 | 0.5543 | 0.0521 |
| 2016 | 2.6411 | 2.0517 | 0.5585 | 0.0821 |
| 2017 | 2.7932 | 1.9972 | 0.5957 | 0.0695 |
| 2018 | 2.5239 | 1.8237 | 0.5037 | 0.0684 |
| 2019 | 2.5384 | 1.8007 | 0.5526 | 0.0549 |
| 2020 | 2.4198 | 1.7138 | 0.5532 | 0.047 |
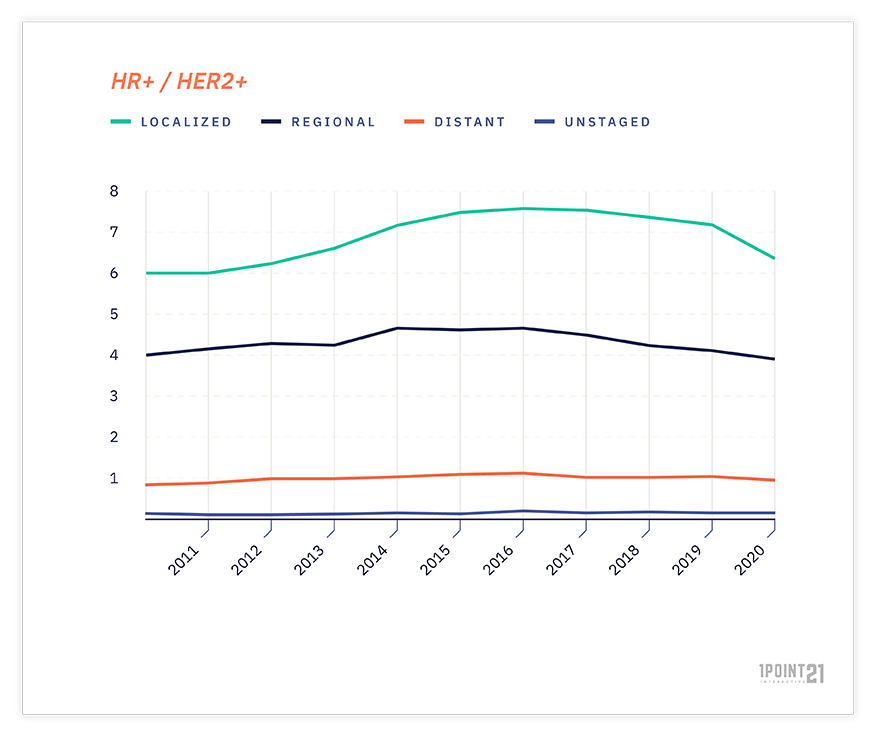
According to the data, HER2+ (both HR+ and HR-) cases tend to be diagnosed as localized cases and occasionally regional cases. In the first half of the 2010’s, cases were increasing, reaching a height of 7.46% in 2016. They then proceeded to decline throughout the rest of the decade, eventually lowering back below 7%.
Early testing and diagnoses may play a role in more cases of cancer being caught in the initial stages, before the cancer can spread and become more difficult to treat by conventional methods.
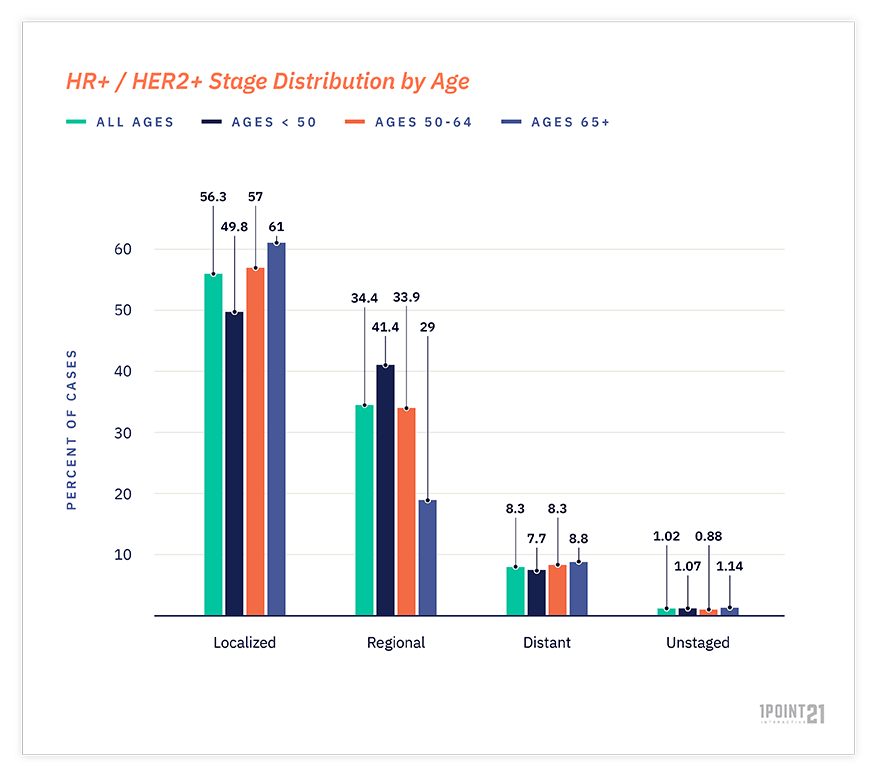
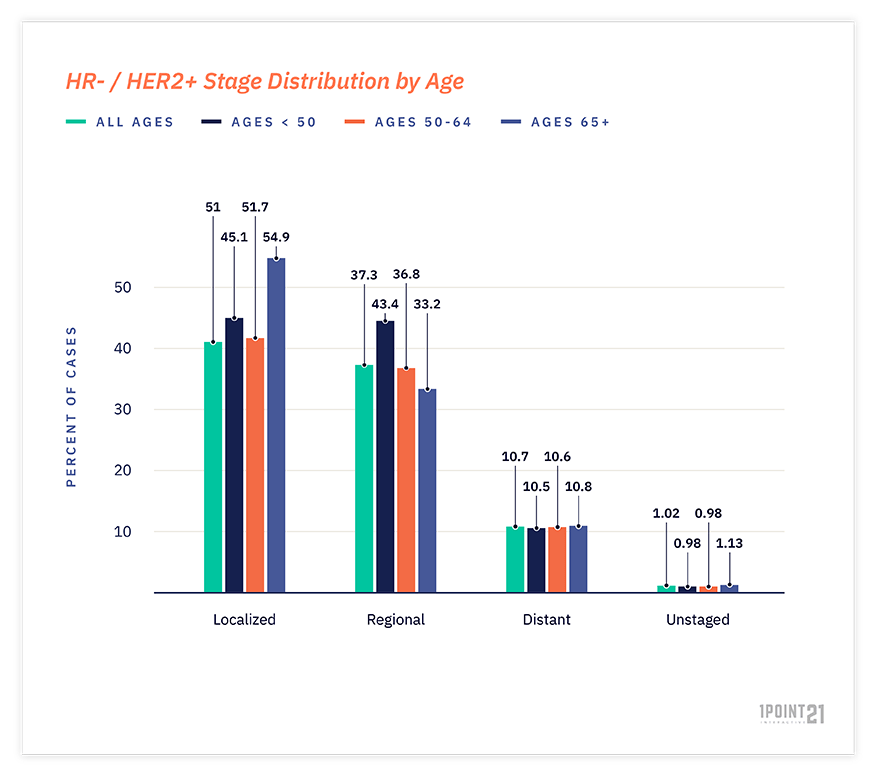
*Note: Sum of values per age group may not equal to 100% as they are rounded to the nearest tenths and hundredths for unstaged cancer values.
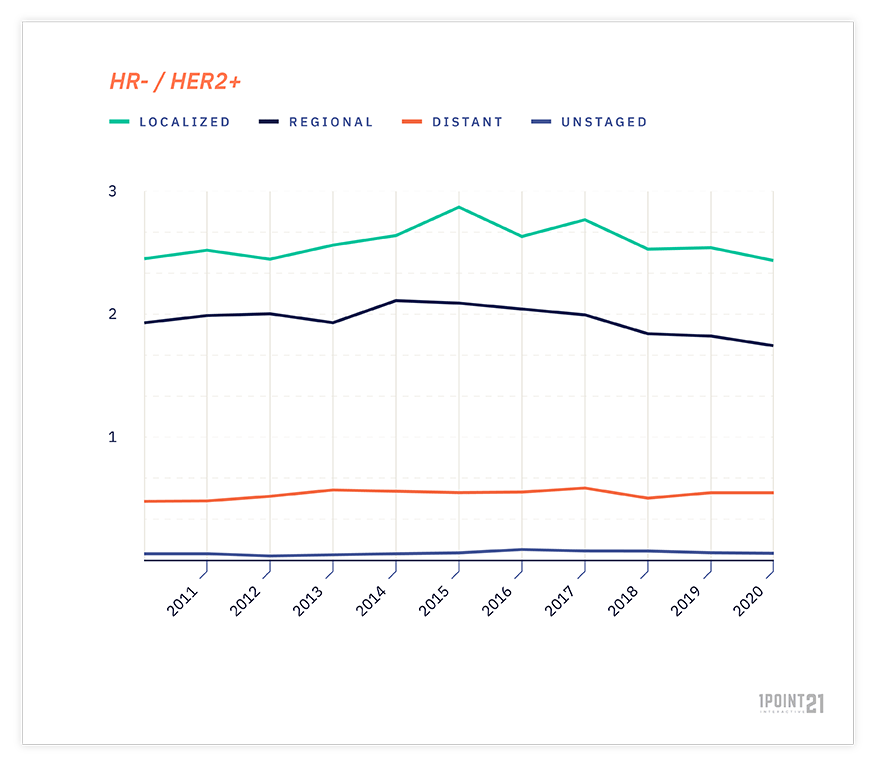
Similar to the general stage distribution of breast cancer, HER2+ cases follow the same trend of having a high number of localized cases, followed by regional, then distant diagnoses. Meanwhile, the number of unstaged cases tends to be extremely low, hovering around only 1 percent per each age group.
Based on the age groups, people under 50 tend to have fewer cases than those over the age of 50, especially over ages 65+. It’s possible that as you get older, you are at a higher risk of developing breast cancer.
In this study, we recorded, analyzed, and graphed breast cancer data across a range of categories from the years 1999 through 2020. Our data was provided by the National Cancer Institute and the Centers for Disease Control and Prevention.
This page has been written, edited, and fact-checked by our team of legal writers in accordance with our editorial guidelines. It has been approved by partners Jane Paulson and John Coletti—respected trial attorneys with decades of experience representing personal injury victims.
Receiving accurate answers during a breast cancer evaluation should be the standard, yet flawed breast cancer tests can alter a person’s life in ways...
385 First Street, Ste 217 Lake Oswego, OR 97034
Get directions