
call today for your free evaluation
call today for your free evaluation
Posted on June 24, 2019 written by Jane Paulson
[1p21video src="https://www.paulsoncoletti.com/wp-content/uploads/2019/06/fourth-of-july-1-1.webm" width="" id="gif_replace_noalignment"]
The Fourth of July weekend is one of the busiest travel holidays of the year. In fact, AAA estimated that nearly 40 million Americans took a road trip of 50 miles or more on Independence Day last year.
However, with the increase in traffic and celebration comes a dramatic increase in fatal motor vehicle crashes.
At Paulson Coletti, our Portland personal injury attorneys want to positively impact the safety of those around us. So, we worked with data visualization firm 1Point21 Interactive to analyze nearly 165,000 fatal crash records and isolate all crashes that occurred during the Fourth of July weekend.
We found that, from 2013-2017, there were 1,923 fatal crashes during the Fourth of July weekend in the United States, killing 2,110 people.
This represents a 27 percent increase in fatalities over a typical day during those years.
It’s more than an increase in overall fatal crashes and fatalities, however. Drunk driving fatalities and pedestrian fatalities increase sharply during the Independence Day weekend as well.
Notably, we found that pedestrian fatalities rose 46 percent during this period. Pedestrians are at an especially high risk during the hours of 9 pm and 1 am, a four-hour window where more than half the pedestrian fatalities (51 percent) took place.
*Figures in red represent an increase in traffic fatalities during the Fourth of July period, while those in blue represent a decrease.
| Rank | State | Fatal Crashes | Fatalities | Pedestrian Fatalities | Fatality Increase |
|---|---|---|---|---|---|
| 1 | Vermont | 7 | 7 | 0 | 146% |
| 2 | New Hampshire | 12 | 13 | 3 | 136% |
| 3 | Alaska | 6 | 7 | 0 | 110% |
| 4 | Idaho | 19 | 20 | 1 | 90% |
| 5 | Utah | 15 | 23 | 9 | 86% |
| 6 | Oregon | 33 | 35 | 5 | 81% |
| 7 | Rhode Island | 5 | 5 | 1 | 79% |
| 8 | West Virginia | 21 | 24 | 2 | 76% |
| 9 | Wyoming | 10 | 10 | 0 | 71% |
| 10 | Missouri | 55 | 69 | 7 | 71% |
| 11 | Hawaii | 8 | 8 | 3 | 64% |
| 12 | Iowa | 22 | 25 | 2 | 56% |
| 13 | Massachusetts | 23 | 26 | 2 | 54% |
| 14 | Mississippi | 43 | 46 | 5 | 49% |
| 15 | Maryland | 35 | 35 | 8 | 48% |
| 16 | South Dakota | 9 | 9 | 0 | 46% |
| 17 | Washington | 33 | 35 | 3 | 45% |
| 18 | Delaware | 7 | 8 | 2 | 43% |
| 19 | Oklahoma | 37 | 45 | 8 | 43% |
| 20 | Illinois | 60 | 68 | 15 | 41% |
| 21 | Maine | 10 | 10 | 2 | 39% |
| 22 | Michigan | 60 | 64 | 16 | 38% |
| 23 | New York | 64 | 70 | 17 | 37% |
| 24 | Alabama | 54 | 58 | 10 | 35% |
| 25 | Colorado | 29 | 35 | 9 | 34% |
| 26 | Texas | 204 | 227 | 40 | 33% |
| 27 | Arizona | 52 | 56 | 14 | 33% |
| 28 | Kentucky | 39 | 46 | 3 | 32% |
| 29 | Indiana | 48 | 50 | 4 | 29% |
| 30 | Kansas | 23 | 24 | 7 | 28% |
| 31 | Wisconsin | 31 | 33 | 2 | 23% |
| 32 | California | 179 | 196 | 64 | 22% |
| 33 | New Mexico | 16 | 20 | 2 | 19% |
| 34 | Nevada | 15 | 17 | 1 | 18% |
| 35 | Pennsylvania | 65 | 66 | 7 | 18% |
| 36 | Louisiana | 38 | 41 | 11 | 17% |
| 37 | Minnesota | 19 | 21 | 3 | 16% |
| 38 | North Dakota | 6 | 7 | 0 | 15% |
| 39 | Tennessee | 49 | 54 | 1 | 14% |
| 40 | Montana | 11 | 11 | 1 | 14% |
| 41 | Ohio | 51 | 57 | 6 | 11% |
| 42 | South Carolina | 45 | 48 | 10 | 11% |
| 43 | Virginia | 38 | 39 | 4 | 9% |
| 44 | Florida | 131 | 144 | 35 | 8% |
| 45 | North Carolina | 67 | 69 | 15 | 7% |
| 46 | Nebraska | 10 | 11 | 0 | 3% |
| 47 | Arkansas | 21 | 24 | 0 | -1% |
| 48 | Georgia | 56 | 62 | 4 | -5% |
| 49 | New Jersey | 20 | 20 | 6 | -27% |
| 50 | Connecticut | 9 | 9 | 6 | -31% |
While we found that, nationally, motor vehicle crash fatalities increase 27 percent during this period, the impact is a mixed bag at the state level. All but four states ( Connecticut, New Jersey, Georgia and Arkansas) saw some level of increase in fatalities during the holiday period. However, 30 states and the District of Columbia had fatalities spike more than the national average (of 27 percent).
BBQs and drinking are closely tied to Independence Day celebrations and the numbers reflect this fact. We found that during the Fourth of July holiday period, 40 percent of all traffic fatalities involved at least one drunk driver (.08 or greater). This is significantly higher than the nearly 30 percent of the five-year period as a whole.
At that state level, North Dakota had the highest percentage of alcohol-related fatalities. In fact, every single traffic fatality in North Dakota during the Fourth of July period involved a drunk driver – the only state where this is true.
*Figures in red are above the national average for the total five year period of 30 percent. Figures in blue are below the national average.
| Rank | State | Total Fatalities | Drunk Driver Fatalities | % of Deaths Involv. a Drunk Driver |
|---|---|---|---|---|
| 1 | North Dakota | 7 | 7 | 100% |
| 2 | Montana | 11 | 9 | 82% |
| 3 | Alaska | 7 | 5 | 71% |
| 4 | South Dakota | 9 | 6 | 67% |
| 5 | Oregon | 35 | 23 | 66% |
| 6 | New Hampshire | 13 | 8 | 62% |
| 7 | Louisiana | 41 | 25 | 61% |
| 8 | Missouri | 69 | 42 | 61% |
| 9 | Rhode Island | 5 | 3 | 60% |
| 10 | South Carolina | 48 | 27 | 56% |
| 11 | Idaho | 20 | 11 | 55% |
| 12 | New Mexico | 20 | 11 | 55% |
| 13 | Kentucky | 46 | 24 | 52% |
| 14 | Delaware | 8 | 4 | 50% |
| 15 | Hawaii | 8 | 4 | 50% |
| 16 | Wyoming | 10 | 5 | 50% |
| 17 | Ohio | 57 | 28 | 49% |
| 18 | Colorado | 35 | 17 | 49% |
| 19 | Iowa | 25 | 12 | 48% |
| 20 | Washington | 35 | 16 | 46% |
| 21 | Nebraska | 11 | 5 | 45% |
| 22 | Wisconsin | 33 | 15 | 45% |
| 23 | Connecticut | 9 | 4 | 44% |
| 24 | Vermont | 7 | 3 | 43% |
| 25 | Michigan | 64 | 26 | 41% |
| 26 | Maine | 10 | 4 | 40% |
| 27 | Maryland | 35 | 14 | 40% |
| 28 | California | 196 | 78 | 40% |
| 29 | Pennsylvania | 66 | 26 | 39% |
| 30 | Massachusetts | 26 | 10 | 38% |
| 31 | Virginia | 39 | 15 | 38% |
| 32 | Minnesota | 21 | 8 | 38% |
| 33 | West Virginia | 24 | 9 | 38% |
| 34 | Texas | 227 | 84 | 37% |
| 35 | Oklahoma | 45 | 16 | 36% |
| 36 | Utah | 23 | 8 | 35% |
| 37 | Georgia | 62 | 21 | 34% |
| 38 | Florida | 144 | 48 | 33% |
| 39 | North Carolina | 69 | 23 | 33% |
| 40 | Tennessee | 54 | 18 | 33% |
| 41 | New York | 70 | 23 | 33% |
| 42 | Indiana | 50 | 16 | 32% |
| 43 | Alabama | 58 | 18 | 31% |
| 44 | Illinois | 68 | 21 | 31% |
| 45 | Nevada | 17 | 5 | 29% |
| 46 | Arizona | 56 | 15 | 27% |
| 47 | Arkansas | 24 | 5 | 21% |
| 48 | New Jersey | 20 | 4 | 20% |
| 49 | Mississippi | 46 | 8 | 17% |
| 50 | Kansas | 24 | 4 | 17% |
When are you most likely to be killed in an Independence Day crash?
Of the days included, the Fourth of July is far and away the deadliest day – with 633 traffic deaths over the 5 year period (with 276 involving a drunk driver).
The block of 9 pm to 12 am had the three highest fatality totals. The highest number of drunk driving fatalities occurred between the hours of 11 pm and 12 am as well, with 95 deaths.
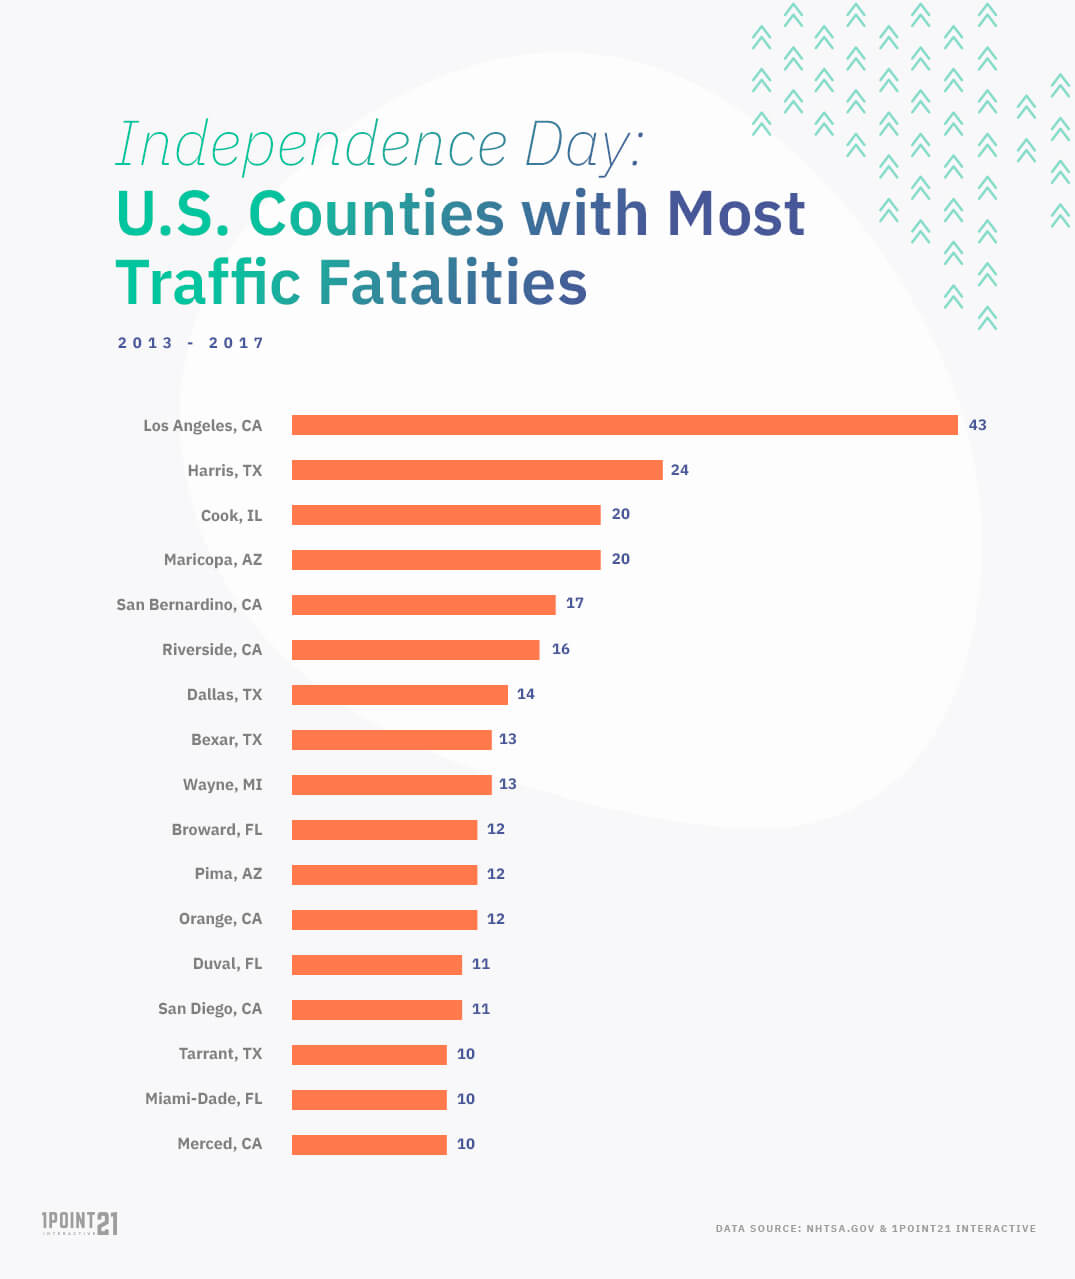
Only 17 counties saw 10 or more traffic fatalities during the holiday period, with Los Angeles, California county leading the way by a significant margin with 43 deaths – followed by Harris County, Texas with 24 and Maricopa County, Arizona and Cook County, Illinois, both with 20. In fact, six of the top 17 counties are located in California.
At Paulson Coletti, we hope that knowing the risks associated with this holiday weekend will affect the decisions that people make and how they approach getting behind the wheel.
Here are a few things to keep in mind to keep yourself and others safe:
Our study is based on fatal crash data provided by the National Highway Traffic Safety Administration for the years 2013-2017.
Defining the holiday period: Because the 4th of July falls on different days each year, this holiday period has been defined as:
The holiday period is from 6 p.m. of the first day listed to 11:59 p.m. of the last day listed, for a total of 17.25 days.
The limitation of this study are two-fold. First, we were not able to take traffic volume and pedestrian volume into account. Our numbers are strictly based on fatality and fatal crash totals. Second, fatal crashes are difficult to predict, especially in low volumes. This is especially prevalent in the state tables. While this data is not predictive of future outcomes, it does show that there is a significant increase in fatal crash risk during this holiday period.
Paulson Coletti and 1Point21 Interactive grant fair use of all images and data contained within this study. If you use our findings or visuals, please cite and link back to this study to give credit to our team.

This page has been written, edited, and fact-checked by our team of legal writers in accordance with our editorial guidelines. It has been approved by partners Jane Paulson and John Coletti—respected trial attorneys with decades of experience representing personal injury victims.
Key Takeaways You can request OEM parts at any point in the repair process, regardless of fault. Oregon’s ORS 746.287 limits insurers from requiring...
Key Takeaways No single average settlement exists because Oregon law often keeps minor settlement records private and sealed. Injury severity, age, the clarity of...
Blind spot accident statistics highlight an alarming trend affecting drivers throughout Portland and nationwide. While modern vehicles are becoming increasingly advanced, many crashes occur...

 (503) 226-6361